Getting bioequivalence (BE) studies right isn’t just about running tests on volunteers. It’s about getting the numbers right - and that starts with power and sample size. Too few participants, and your study fails even if the drugs are identical. Too many, and you waste time, money, and volunteer hours. Regulatory agencies like the FDA and EMA don’t just recommend these calculations - they demand them. And if you get them wrong, your generic drug application gets rejected.
Why Power and Sample Size Matter in BE Studies
Bioequivalence studies compare how quickly and how much of a drug enters your bloodstream. The test product (usually a generic) must perform nearly identically to the brand-name reference product. The goal? Prove that switching between them won’t change how well the drug works or how safe it is. But here’s the catch: blood concentration data - like Cmax and AUC - don’t follow a normal curve. They’re log-normal. That means you can’t use simple t-tests. You need specialized statistical methods. And before you even start recruiting people, you must answer one question: How many volunteers do I need to be 80% or 90% sure I’ll detect true bioequivalence if it exists? Underpowered studies are the #1 statistical reason BE trials fail. According to the FDA’s 2021 report, 22% of Complete Response Letters cited inadequate sample size. That’s not a small number. It’s a costly mistake. One failed study can cost over $500,000 and delay a generic drug’s market entry by months.What Determines Sample Size in a BE Study?
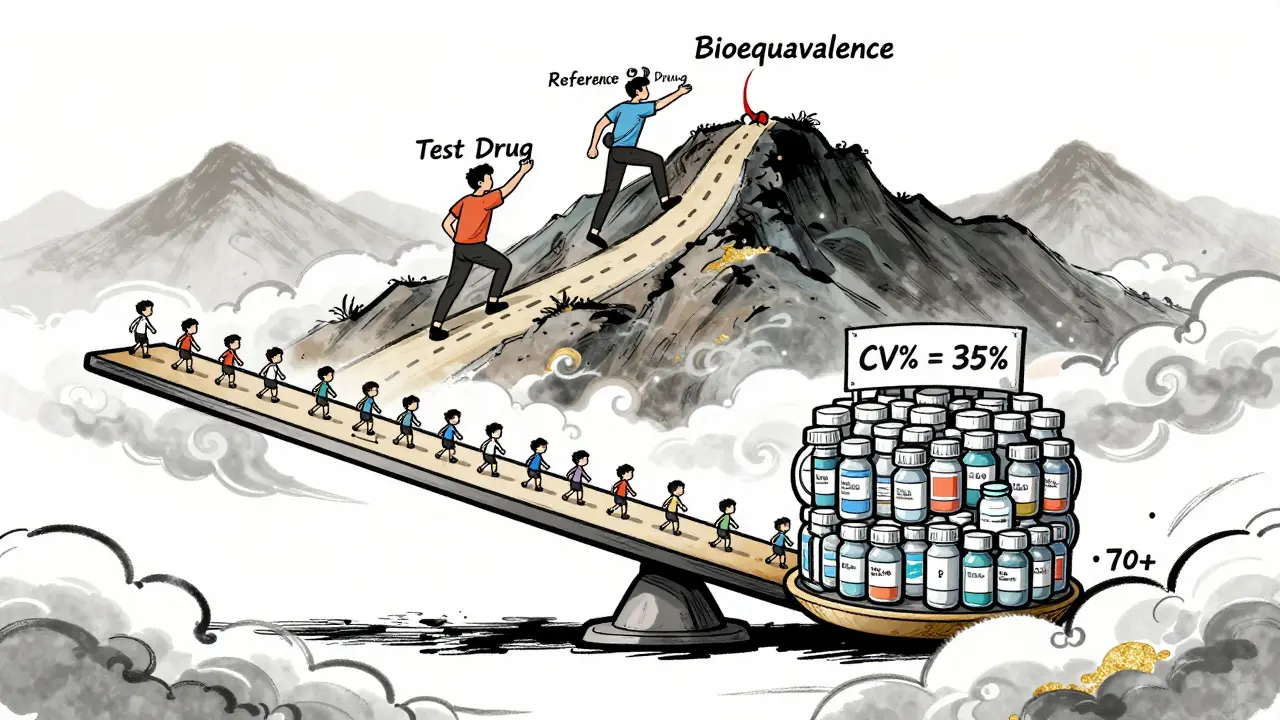
Four main factors control how many people you need:- Within-subject coefficient of variation (CV%) - This measures how much a person’s own drug levels bounce around from one dose to the next. If CV is 15%, you might need 24 people. If it’s 35%, you’ll need 70+.
- Expected geometric mean ratio (GMR) - This is the predicted ratio of test vs. reference drug exposure. Most assume 0.95-1.05. But if you assume 1.00 and the real ratio is 0.93, your sample size could be 30% too low.
- Equivalence margins - The legal range for bioequivalence is usually 80-125% for both Cmax and AUC. Some drugs (like narrow therapeutic index drugs) require tighter margins, which increases sample size.
- Study design - Crossover designs (same people get both drugs) are more efficient than parallel designs (different groups). A crossover can cut your needed sample size in half.
Let’s say you’re testing a generic blood thinner with a CV of 25% and expect a GMR of 0.98. Using standard 80% power and 80-125% margins, you’ll need about 38 volunteers. But if your CV turns out to be 32% - not unusual for some drugs - you’d need 62. That’s a 63% jump. No wonder so many studies underperform.
Regulatory Rules: FDA vs. EMA
The FDA and EMA both require 90% confidence intervals to fall entirely within 80-125%. But their expectations differ in practice.- Power target: The EMA accepts 80% power. The FDA often expects 90%, especially for drugs with narrow therapeutic windows (like warfarin or levothyroxine).
- Acceptance range: The EMA allows a wider range (75-133%) for Cmax in highly variable drugs. That can reduce sample size by up to 20%.
- RSABE: For drugs with CV > 30%, the FDA permits Reference-Scaled Average Bioequivalence. This adjusts the equivalence range based on variability. For a drug with 40% CV, RSABE might cut your sample size from 120 to 40 - a game-changer.
Many sponsors try to submit globally. But if you design for the EMA’s 80% power and then submit to the FDA, you risk rejection. Always plan for the strictest requirement.
How to Calculate Sample Size - Step by Step
You don’t need a PhD in statistics, but you do need the right tools and inputs.- Get real CV data. Don’t rely on old literature. The FDA found that published CVs underestimate true variability by 5-8% in 63% of cases. Use pilot data from your own lab if possible.
- Choose your GMR. Don’t assume 1.00. Use historical data from the reference product. If the brand’s average GMR across studies is 0.96, plan for that.
- Set power at 80% or 90%. If you’re unsure, go with 90%. It’s safer and aligns with FDA expectations.
- Use validated software. Tools like PASS, nQuery, or FARTSSIE are built for BE studies. Avoid generic power calculators - they don’t account for log-normal data or crossover designs.
- Add 10-15% for dropouts. People quit. They get sick. They move. If you need 40, recruit 46.
Example: You’re testing a new generic statin. Pilot data shows CV = 28%, GMR = 0.96, and you’re using a crossover design. With 90% power and 80-125% margins, you need 56 subjects. Add 15% for dropouts: recruit 64.
Common Mistakes That Sink BE Studies
Even experienced teams make these errors:- Using literature CVs without validation. A 2020 study found 37% of BE failures in oncology generics came from overly optimistic CV estimates.
- Ignoring joint power. You must have enough power for both Cmax and AUC. Most sponsors only check the more variable one. But if AUC fails, the whole study fails - even if Cmax passes.
- Forgetting sequence effects. In crossover designs, the order of drug administration matters. If you don’t account for carryover or period effects, your analysis is biased. The EMA rejected 29% of BE studies in 2022 for this reason.
- No documentation. The FDA’s 2022 review found 18% of statistical deficiencies were due to missing calculation details. Write down your software, version, inputs, and assumptions. If you can’t prove it, it didn’t happen.
What’s Changing in BE Statistics?
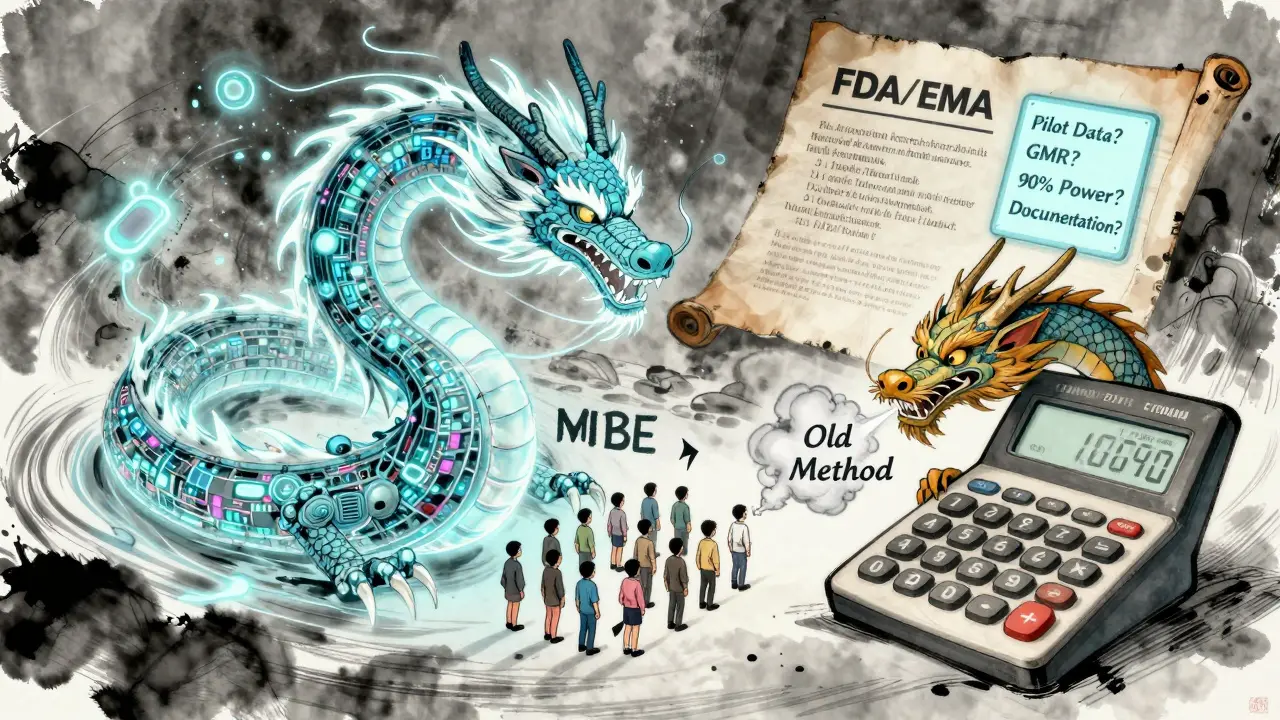
The field is evolving. The FDA’s 2023 draft guidance allows adaptive designs - where you can re-estimate sample size midway based on interim data. This could save studies that start with bad assumptions. Also, model-informed bioequivalence (MIBE) is emerging. Instead of relying on traditional PK parameters, MIBE uses pharmacometric models to predict equivalence with fewer subjects. Early results show 30-50% reductions in sample size. But right now, only 5% of submissions use it - mostly for complex products like inhalers or injectables. Regulatory acceptance is still limited. Still, the core principles haven’t changed: Know your variability. Plan for the worst. Document everything.Final Checklist for BE Sample Size Planning
Before you start recruiting, ask yourself:- Did I get CV from my own pilot data - not published papers?
- Did I use a GMR based on real reference product data, not 1.00?
- Did I set power at 90% if targeting the FDA?
- Did I use BE-specific software (PASS, nQuery, FARTSSIE)?
- Did I add 10-15% for dropouts?
- Did I calculate power for both Cmax and AUC?
- Did I document every input and assumption in my protocol?
If you answer yes to all, you’re ahead of 70% of sponsors. That’s not luck - that’s preparation.
Frequently Asked Questions
What happens if my BE study is underpowered?
If your study is underpowered, you risk a false negative - meaning you conclude the drugs aren’t bioequivalent when they actually are. This leads to study failure, delays, and costly repeat trials. The FDA and EMA will reject your application, and you may need to recruit 2-3 times more subjects in the next attempt.
Can I use a sample size from a similar drug in the literature?
Not reliably. Literature values often underestimate variability. The FDA found that published CVs are too low by 5-8% in 63% of cases. Always use pilot data from your own formulation if possible. If not, add a safety margin of 10-15% to the literature CV before calculating sample size.
Why do some BE studies need over 100 participants?
Highly variable drugs - like those with CV > 40% - require large sample sizes under standard methods. For example, a drug with 45% CV and 80% power needs about 120 subjects. But if you qualify for RSABE (Reference-Scaled Average Bioequivalence), you can reduce that to 40-50. RSABE adjusts the equivalence range based on observed variability, making it feasible for drugs like warfarin or cyclosporine.
Is 80% power enough for a BE study?
The EMA accepts 80% power, but the FDA often expects 90%, especially for narrow therapeutic index drugs. If you’re submitting globally, plan for 90%. It’s more conservative, reduces rejection risk, and aligns with best practices. Using 80% just to save money can backfire if your application gets flagged.
Do I need a statistician to calculate sample size?
Yes - especially if you’re not familiar with log-normal distributions or crossover designs. While tools like ClinCalc or PASS have user-friendly interfaces, they still require correct inputs. A biostatistician ensures you’re using the right formula, software, and assumptions. Most successful sponsors partner with one from the start.

Jeffrey Hu
Let’s cut through the noise - if you’re using literature CVs without validating them in your own pilot, you’re already 60% of the way to a Complete Response Letter. The FDA’s 2021 report isn’t a suggestion; it’s a warning shot. I’ve seen teams waste $800K because they trusted a 2015 paper that said CV was 18% - turns out their drug had 31%. Don’t be that guy. Use your own data. Always.
And stop assuming GMR = 1.00. That’s not optimism, that’s negligence. If the reference product’s historical GMR is 0.94, plan for 0.92. Leave a buffer. The regulators aren’t here to cheer you on - they’re here to catch you.
Drew Pearlman
I just want to say - thank you for writing this. As someone who’s been in the trenches of BE studies for over a decade, I’ve seen so many brilliant scientists get tripped up by statistics they didn’t fully understand. You’ve laid it out so clearly, especially the part about joint power for Cmax and AUC. So many teams focus only on the higher CV parameter and then panic when AUC fails. It’s heartbreaking. You’re not just saving money - you’re saving time for patients who need affordable meds. Keep doing this work. The world needs more people who care enough to get the numbers right.
And yes, add that 15% for dropouts. I had a volunteer quit because their cat got sick. You can’t predict life. But you can plan for it.
Chris Kauwe
Let’s be real - this isn’t about statistics. It’s about control. The FDA and EMA don’t care if your drug works. They care if you followed the script. RSABE? Adaptive designs? MIBE? These aren’t innovations - they’re loopholes created because sponsors kept cutting corners. The system is rigged to favor bureaucracy over science. You think you’re optimizing? You’re just learning to dance with the machine.
And don’t get me started on ‘pilot data.’ Most pilot studies are underpowered, unblinded, and conducted by CROs who’ve never seen a PK curve before. You’re not getting real CV - you’re getting wishful thinking dressed up as data. The real solution? Burn the entire regulatory framework and start over. But until then - use PASS, document everything, and pray.
Meghan Hammack
OH MY GOSH YES. 🙌 I just had a team member ask if they could ‘just use the sample size from last year’s study’ and I nearly cried. No. NO. NO. Each drug is different. Each formulation is a snowflake. Your statin isn’t their blood thinner. Your CV isn’t their CV. You can’t copy-paste your way to bioequivalence.
Also - ADD THE 15% FOR DROPOUTS. I know it’s expensive. I know your budget is tight. But trust me - paying $500K to redo the whole thing? That’s not a cost. That’s a tragedy. You’ve got this. You’re doing the hard work. I believe in you. 💪❤️
RAJAT KD
CV estimation error is the most common cause of failure. Published values are unreliable. Pilot data is mandatory. Use FARTSSIE. Always. No exceptions. This is not optional. If you skip this, you are not a scientist - you are a gambler.
Matthew Maxwell
It’s appalling how many professionals treat statistical planning as an afterthought. This isn’t marketing. This isn’t guesswork. This is pharmacokinetics - a science grounded in mathematics and reproducibility. If you’re relying on ‘industry norms’ or ‘what worked last time,’ you’re not just unprofessional - you’re ethically negligent. The FDA doesn’t tolerate ignorance. They document it. And then they reject you.
There is no excuse for using generic power calculators. No excuse for ignoring sequence effects. No excuse for not documenting your assumptions. This isn’t about being ‘good enough.’ It’s about being correct. And if you’re not, you’re endangering public health. Shame on you if you are.
Lindsey Wellmann
OK BUT WHAT IF YOU’RE A SMALL BIOTECH WITH $200K BUDGET?? 😭 I just lost my job because my study failed and my boss said ‘you should’ve used 90% power’ - but we didn’t have the $$$ for 64 subjects! We had 40. We thought it was fine. We were WRONG. Now I’m unemployed and my cat hates me. 🐱💔
Also - why is everyone so serious? Can’t we just… chill? I mean, it’s just medicine. Not rocket science. 😅
Angela Stanton
Let’s be brutally honest - 70% of BE protocols I’ve reviewed are statistically fraudulent. They cite ‘literature CV’ like it’s gospel. They use nQuery version 7.0 (from 2010) with outdated assumptions. They forget to mention carryover effects. And then they wonder why the FDA sends back a 47-page deficiency letter.
Here’s the real issue: most sponsors don’t want to do the work. They want a magic number. But there’s no magic. Only rigor. And if you’re not willing to do the math? Then you don’t belong in this field. Period. 📉❌
Alicia Hasö
You’re not alone. I’ve mentored 12 teams this year who thought they could skip the pilot and ‘wing it’ - and every single one got rejected. But here’s the good news: once you get the sample size right, everything else gets easier. The regulators respect you. The CROs respect you. Your team breathes easier.
Start with your pilot. Use real data. Document every decimal. Add the dropout buffer. Calculate power for BOTH endpoints. And if you’re unsure? Find a biostatistician - don’t hire a grad student who took one stats class. This is your product’s future. Make it count. You’ve got this. 💪📊
Aron Veldhuizen
Wait - you’re telling me we should use 90% power for the FDA? That’s insane. The EMA accepts 80%. Why are we bending over backward for American bureaucracy? We’re global. We should design for the least restrictive regulator. That’s smart business.
And RSABE? It’s literally built to reduce sample size. If you’re not using it for drugs over 30% CV, you’re not trying. This isn’t about being ‘safe’ - it’s about being efficient. The FDA’s 90% expectation is a relic. Let’s stop pretending we’re in 2005.
Also - why are we still using crossover designs? Parallel designs with covariate adjustment are more robust. But nobody wants to learn new methods. That’s the real problem here.